What is RSI ?
10
Relative Strength Index
is a touchable example of a basketball ball. If we abandon it from above, in numerous collisions to the ground, it will be at a lower altitude each time and eventually it will be placed on the ground.
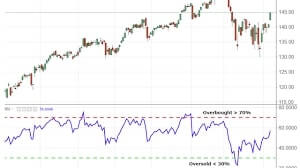
if the chart relative strength index such a situation to your place. it means, that the price of the stock, etc., reducer, will be, and vice-versa. if the chart relative strength index on the status of the hub was, which alternately by the hand of the player to hit it and can be up to a height of more high come. Anecdote is an increase in the relative power of the contribution to move upwards.
if the vertices of the peaks or , etc. linear drawing things. the process of formed, by the process of future share would be and also if the Relative Strength Index on the trend line, the aforementioned influence it. means change process, the price of the share.
and it can be seen in the default section of all trading platforms. This index is in the category means to swing a Than give up to the notion that the manner of computing to so that for the trends to come there in the market ceilings (over bought)and the floor are (over sold) to determine. Perhaps, the use of the best trading theory, the same as buying at the lowest price and selling at the highest price is the key to the success of this instrument among technical analysts.
